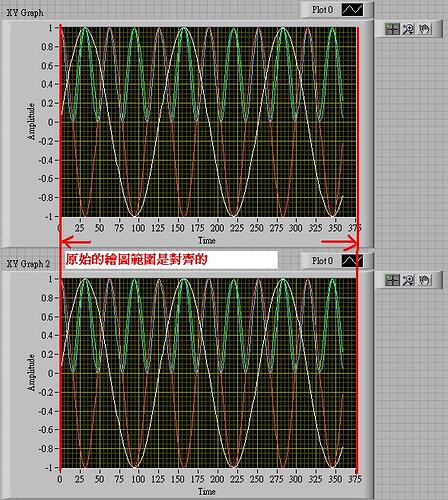
<span =“apple-style-span” style="font-size: 16px; line-height: 24px; ">各位前輩好
我將兩個XY Graph組成一組,
使X軸的scale能連動,並調好顯示區域.
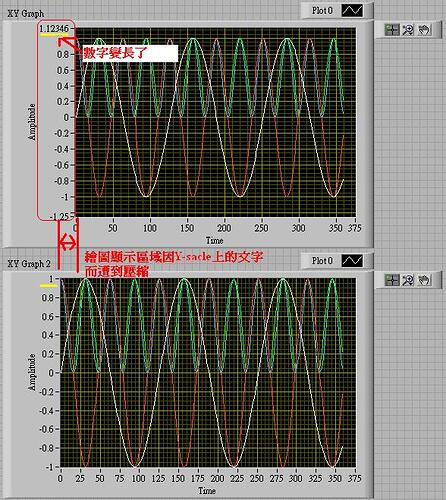
但發現顯示區域會因Y軸Scale顯示而變化,
破壞了原本的設計,
想請問有沒有甚麼方法能讓顯示區域大小固定呢?
謝謝!

在Y軸上按右鍵,將AutoScale Y不要勾選

感謝DonWang前輩的回應,
抱歉我原本的說明不夠清楚,
AutoScale Y取消勾選後雖然畫面不會自動縮放,
但若使用Graph Palette工具手動放大或縮小畫面,
<font =“apple-style-span” color=“#ff0000”>顯示區域的大小仍然會因<font =“apple-style-span” color=“#ff0000”>Y軸數字長度而變寬或變窄.
雖然嘗試過properties>Display Format->Use minimum field with->
中的Pad with zeros on left等選項,
但仍然無法<font =“apple-style-span” color=“#ff0000”>固定顯示區域的寬度與位置,
造成兩個XY Graph無法共用X軸.
附帶一提,
之所以要將兩個XY Graph合在一起使用的原因,
是因為其顯示的兩個波形有相同的X軸,
但Y軸Scale極距卻相差很大,
因此無法將兩者放在一起顯示?
雖然有嘗試過使用Mixed Signal Graph,
但由於顯示的視窗畫面有限,
很難塞入三組畫面,
而且我在使用Mixed Signal Graph的cursor上遇到許多問題
因此放棄使用.
這問題已經困擾我許久了,
希望各位前輩能幫我想個辦法,
感激不盡!
加個程式當Scale Range Change時,將Y軸重新設定


<span =“apple-style-span” style="font-size: 16px; line-height: 24px; ">>>加個程式當Scale Range Change時,將Y軸重新設定
感謝DonWang前輩的回答,
經嘗試後發現這樣做會使Y軸無法縮放至想要的大小,波形就看不清楚了...
若是有人知道如何將顯示區域大小固定,或是讓兩個XY Graph的X軸同步,還請提示小弟一下.感激不盡!
"Y軸無法縮放至想要的大小,波形就看不清楚了",Y軸的大小不是說可自行設定嗎???下面程式參考.
110705.vi
>><span =“apple-style-span”=“” style=“font-size: 16px; line-height: 24px; “>“Y軸無法縮放至想要的大小,波形就看不清楚了”,Y軸的大小不是說可自行設定嗎???下面程式參考.
<font =“apple-style-span”=”” size=“3”><span =“apple-style-span”=“” style=“line-height: 24px;”>是的,<span =“apple-style-span”=“” style=“font-size: 16px; line-height: 24px; “>Y軸的大小可自行設定,
<span =“apple-style-span”=”” style=“font-size: 16px; line-height: 24px; “>但若是設定死了,就無法使用<span =“apple-style-span”=”” style=“font-size: 16px; line-height: 24px; “>Graph Palette工具手動放大或縮小想要觀察的部分.(會自動跳回設定值)
<span =“apple-style-span”=”” style=“font-size: 16px; line-height: 24px; “>
<span =“apple-style-span”=”” style=“font-size: 16px; line-height: 24px; “>我遇到的問題是程式剛執行時所顯示的圖形區域寬度是一樣寬的,
<span =“apple-style-span”=”” style=“font-size: 16px; line-height: 24px; “>但若<span =“apple-style-span”=”” style=“font-size: 16px; line-height: 24px; “>使用<span =“apple-style-span”=”” style=“font-size: 16px; line-height: 24px; “>Graph Palette縮放某一區域,
<span =“apple-style-span”=”” style=“font-size: 16px; line-height: 24px; “>圖形<span =“apple-style-span”=”” style=“font-size: 16px; line-height: 24px; “>顯示區域會自動調整以容納Y軸的scale,
<font =“apple-style-span”=”” size=“3”><span =“apple-style-span”=“” style=“line-height: 24px;”>雖然已嘗試過限制<span =“apple-style-span”=“” style=“font-size: 16px; line-height: 24px; “>Y軸scale的解析度(字元長度),
<span =“apple-style-span”=”” style=“font-size: 16px; line-height: 24px; “>但還是無法固定…
<span =“apple-style-span”=”” style=“font-size: 16px; line-height: 24px; “>
<span =“apple-style-span”=”” style="font-size: 16px; line-height: 24px; ">
tingway40730.7938888889
終於了解你的問題了!!!請在Display Format中設定顯示的形式,%0.1f中的1表示小數位數,小數點前有0與沒有0,分別顯示0.0與0.

>><span =“apple-style-span”=“” style=“font-size: 16px; line-height: 24px; “>請在Display Format中設定顯示的形式,%0.1f中的1表示小數位數,小數點前有0與沒有0,分別顯示0.0與0.
<font =“apple-style-span”=”” size=“3”><span =“apple-style-span”=“” style=“line-height: 24px;”>此法能限制小數位數長度,但對於整數位數似乎沒有限制效果?(限制了也不合理)
<font =“apple-style-span”=“” size=“3”><span =“apple-style-span”=“” style=“line-height: 24px;”>
<font =“apple-style-span”=“” size=“3”><span =“apple-style-span”=“” style=“line-height: 24px;”>後來發現在Property Node->Plot Area->Size中可限制繪圖區域大小 ,但若<span =“apple-style-span”=“” style=“line-height: 24px; font-size: medium; “>繪圖區域大小固定,Y軸Scale字元顯示長度改變,則整個Graph的寬度也會跟著變寬,糟糕的是<span =“apple-style-span”=”” style=“line-height: 24px; font-size: medium; “>Graph大小(<span =“apple-style-span”=”” style=“line-height: 24px; font-size: medium; “>Property Node->Bounds<span =“apple-style-span”=”” style=“line-height: 24px; font-size: medium; “>)似乎只能read不能write.
<span =“apple-style-span”=”” style=“line-height: 24px; font-size: medium; “>
<font =“apple-style-span”=”” size=“3”><span =“apple-style-span”=“” style=“line-height: 24px;”>經過多次嘗試,發現若使用SI notation並限制小數點位數,則整數位最多出現三位數,如此便可大略估計<span =“apple-style-span”=“” style=“line-height: 24px; font-size: medium; “>繪圖區域大小,但整體<span =“apple-style-span”=”” style="line-height: 24px; font-size: medium; ">Graph大小還是會亂跑…@@
tingway40730.4965393519
你可以試試看Property Node=>Plot Area Bounds固定左上與右下角
110706.vi
DonWang40730.6883680556
>>你可以試試看Property Node=>Plot Area Bounds固定左上與右下角
此法有效!!
原來是要用Plot Area Bounds固定顯示範圍,
感謝DonWang前輩的大力幫忙!

